In this guide, we will detail the process of monitoring Windows hosts using Zabbix, covering everything from installing the Zabbix agent to connecting Windows nodes with the Zabbix server, as well as collecting metrics and setting up alerts.
Installing Zabbix Agent on a Windows Machine
To monitor a Windows Server 2022 host, you need to install and configure the Zabbix agent. Start by downloading the pre-compiled MSI installer for the Zabbix agent from the official website. Ensure you choose the agent version that corresponds to your Windows version. For the latest OS versions, Zabbix Agent 2 is recommended.
During installation, you will be prompted to enter the host name of your computer and the DNS name or IP address of the Zabbix server. If your Windows host is behind a NAT and not directly accessible, use the Active agent mode. Enter the server’s address in the Server for active checks field.
To encrypt the communication between the Zabbix server and the agent, use a Pre-Shared Key (PSK). Generate a random PSK value via PowerShell and input it into the agent installer.
After installation, confirm that the Zabbix Agent 2 service is listed among the Windows services. Configuration changes can be made in the zabbix_agent2.conf file, located in the installation directory. After any adjustments, restart the Zabbix agent service for changes to take effect.
How to Add a New Windows Host to Zabbix
With the Zabbix agent installed, you can now add the new host to the Zabbix server through its web interface:
- Navigate to Configuration > Hosts > Create Host.
- Set the host name to match what is specified in the agent config.
- Assign a template, such as the standard Windows template by Zabbix agent active, and select a host group.
- Add the interface by specifying the DNS name or IP for passive checks.
- In the Encryption tab, enable encrypted connections and input the PSK from the client setup.
If configured properly, data should begin to flow from the Windows host into the Zabbix Monitoring section within minutes.
Collecting Metrics from a Windows Host with Zabbix
To monitor specific metrics on a Windows machine, like Zabbix agent availability, disk usage, and network connections, you can customize your metrics collection.
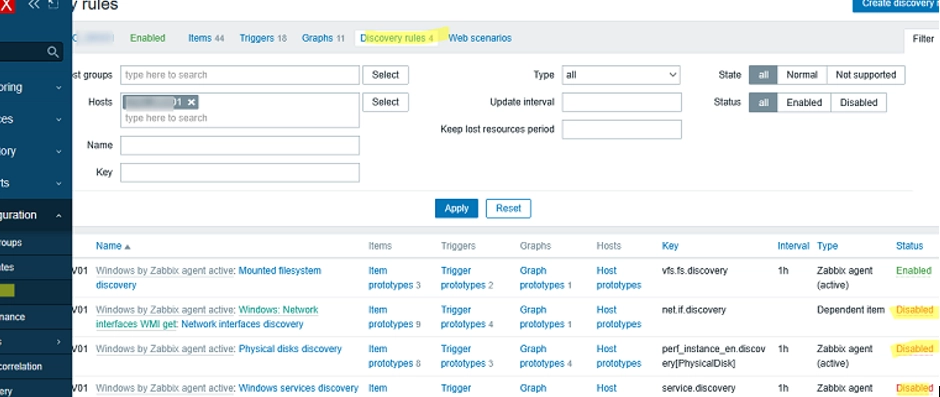
Zabbix automatically activates numerous items via Low-Level Discovery, which can be disabled if not needed. For instance, you might choose to disable the autodiscovery for certain services and metrics.
Only specific metrics will be monitored: disk usage for drives C: and D:, agent availability, and the number of active network connections on the web server. For the latter, create a custom metric using a command executed via PowerShell.
Modify the zabbix_agent2.conf file to include the command for counting active HTTPS sessions and increase the Timeout value to accommodate longer executions.
Test the new configuration by using zabbix_get.exe to ensure the custom metric works.
Finally, add the custom metric to the corresponding Zabbix template or host, and create an alert trigger for metrics that exceed a certain threshold, such as active HTTPS sessions potentially indicating a DDoS attack.
With these configurations, you have successfully set up your Zabbix monitoring environment for Windows hosts, allowing you to collect crucial system metrics and alerts for effective management.
For further guidance, you may refer to the Zabbix installation guide and learn more about PowerShell scripts in Zabbix.