Security Onion is designed as a standalone Linux distribution based on Oracle Linux 9. The system can be installed on physical hardware or virtual machines (VMs), such as in VMware Workstation Pro, Hyper-V, or Proxmox. However, the developers also provide images for Azure, AWS, and GCP.
Use cases for Security Onion deployment
The solution offers comprehensive insights into network traffic with tools for Intrusion Detection Systems (IDS), such as Security Information and Event Management (SIEM) and Network Security Monitoring (NSM).
Moreover, it permits alerts in real-time and admission to past data. This aids in pinpointing and rapid reaction to likely threats.
The focal point of Security Onion is managing log files generated by individual servers and network devices. The capability of importing and scrutinizing these files is an integral part of Security Onion, which also supports multiple formats such as Syslog.
Installation of Security Onion on VMware Workstation
Post downloading the approximately 11 GB ISO file, a VM is to be created, select Typical, and then attach the ISO. VMware Workstation can identify the Oracle Linux 9 operating system.
For VM configuration, adhere to the hardware requirements, regardless of the virtualizer you chose:
- 200 GB of storage space for the virtual hard drive to make all features of Security Onion available. Store this in a single file.
- At least 4 GB of RAM, but 8 or 16 GB is better.
- Two to eight virtual CPUs.
- NAT connections or a bridged network can be used for networking. The first adapter manages Security Onion. For network monitoring, add another bridged adapter to the VM.
After starting the VM with Security Onion, you install the operating system and various tools. The setup is done via a wizard. You first confirm the disk’s deletion and create an admin user.
Install Security Onion using a wizard
After the basic installation and a reboot, you can configure the environment. Security Onion also provides a wizard for this, and the process is self-explanatory.
It is essential to correctly assign network adapters for monitoring and management and set the IP addresses or IP subnets that can access the management interface.
Configuring Security Onion after the installation
Getting started with Security Onion
After logging in at the terminal, you can check the individual services of Security Onion with this command
sudo so-status
You can log in to the web interface if all services have started without errors. The URL for this can be taken from the terminal.
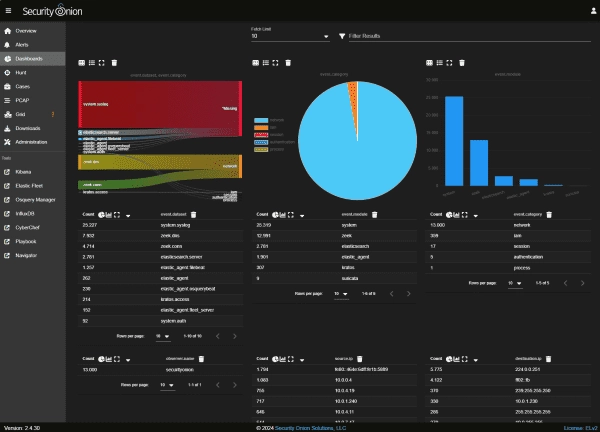
The console aggregates various tools under one interface. Initial information on network traffic can be found under the Dashboards menu item.
More information on the various possibilities can be found in the Security Onion documentation for first-time users.
The Grid menu item displays the status of the individual containers utilized by Security Onion for service initiation. In broader contexts, multiple Security Onion instances can be merged into a shared platform. This platform allows individual nodes to undertake designated tasks.
Importing Events from Windows Server into Security Onion
To transfer logs from a Windows server to Security Onion, initially store the log on the server as an EVTX file. This is achievable using the Event Viewer (eventvwr.msc). Once you right-click on a log (for instance, Windows Logs => System), executing the ‘Save All Events As’ command will do this.
Saving log entries with Event Viewer on a Windows Server
Importing the file for further analysis into Security Onion can be accomplished via the web browser console under Grid, using the upload icon at Node Status. This may take a little while. When analysis concludes, you may access alert information.
Importing log files of a Windows Server into Security Onion
In the scenario where you want to manually import, the Elastic Winlogbeat agent can be used to transfer event logs from Windows systems to the Security Onion’s Logstash server. You can define in winlogbeat.yml what events the server should forward to Security Onion. There’s a sample file included with the agent for this intent.
The focus of analysis, as you might expect, is on security-significant entries that signal cyber attacks or any suspicious activities. This encompasses user logins, unsuccessful logins, and attempts to access.
Security Onion can also look for signs of malware activity, such as unusual file operations, registry changes, or suspicious network communication.
Summary
Security Onion is an open-source platform that gathers various tools for threat hunting, security monitoring, and log management. Installing the underlying Linux and the application itself is straightforward via wizards.