Grafana Loki benefits
Here are a few key features of Grafana Loki:
- Scalability: Loki was designed with horizontal scaling in mind, making it capable of managing large volumes of log data.
- Label-based indexing: Loki uses label-based indexing (metadata to describe a log stream) to organize and query data.
- Distributed and highly available: Loki offers distributed and highly available deployment models to improve log availability and resilience.
- Integrations: Loki seamlessly integrates with Grafana dashboards so that you can visualize logs.
Install Loki and Promtail
Loki can be installed on various systems, including Docker and Kubernetes, or as a standalone system on Linux. Promtail is the log collection agent used to collect and send logs to Loki. I will use apt-get for this guide to install Loki and Promtail on Ubuntu.
sudo apt-get install loki promtail
Install Loki and Promtail to collect logs
Install Loki and Promtail to collect logs
You can now start and enable the Loki service using the commands below.
sudo systemctl start lokisudo systemctl enable loki
Use the status command to verify that Loki is running.
sudo systemctl status loki
Now you can enable the promtail service using these commands:
sudo systemctl start promtailsudo systemctl enable promtail
Use the status command to check whether Promtail is running.
sudo systemctl status promtail
Start and enable the Promtail service on Ubuntu
Grafana Loki integration
Once you have installed Loki and Promtail to collect logs, you can use Grafana for querying and visualization. Follow the steps below.
Add Loki as a data source
Go to Grafana’s home and navigate to the Data sources section.
Navigate to Data sources section of Grafana
Click Add new data source.
In the Choose a data source type field, search for Loki, and click it.
By default, Loki runs at https://localhost:3100. Enter this as the URL.
Click Save & test.
You should now see the message Data source successfully connected. Click the building a dashboard link.
Set the data source as Loki for the dashboard.
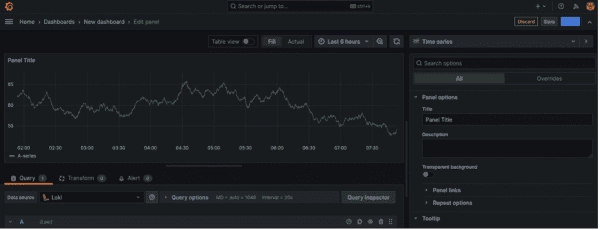
The dashboard will open, and you will see the time series visualization for the logs collected by Loki and visualized by Grafana.
Default Grafana dashboard for the Loki data source
Query Loki logs
Once the Loki data source collects the logs, you can search for specific logs using PromQL, Loki’s query language. Go to the side navigation bar, and click Explore.
From the dropdown list in the top left corner, select Loki as the data source. Now, you will get a query editor to run queries on the logs. Click Label filters.
Query editor for the Loki data source in Grafana
You will get two options to select a label to search. Choose a filename, and then select a log file.
Label browser in Grafana query editor
Scroll down, and click Show logs.
Show logs based on the selected labels
Show logs based on the selected labels
In the query editor, you can see that the query was automatically created, and the visualization for alternatives.log has started coming in.
Visualization of the logs collected by Loki
Visualization of the logs collected by Loki
When you scroll down, you will see the logs collected with dates and times.
Details of the logs collected by Loki
You can write queries directly to filter and search logs based on labels, keywords, and time ranges. Here are some examples:
- To search for logs with a specific keyword: {|=~”keyword”}
- To filter logs by labels: {job=”varlogs”}
- To search for logs within a time range: {job=”varlogs”} |= “keyword” |~ “5m”
Below is an example where I am searching for only error logs in the bootstrap.log file. I am filtering the logs based on the keyword “error.”
Querying logs using label filters
When you click Run query, you will get the list of all error logs in the bootstrap.log file.
Filtering out error logs collected by Loki
Similarly, if you edit the query using the keyword “update,” you will get the details of all the updates in the log file.
