This post will guide you in debugging containerized apps running in Docker using Visual Studio (VS) Code.
Prerequisites
The following things are required to follow along with this post:
- Visual Studio Code
- Docker
Debugging a PHP app
- Visual Studio Code has built-in support for debugging Node.js apps, but for setting up debugging for a PHP application, you need to install the PHP Debug extension. This can be achieved by clicking the Extensions tab on the left pane or using the shortcut Ctrl+Shift+X keys. Search for the PHP Debug extension and install it.
- Create a new folder for your project and add a PHP file to execute and debug in a container. Here, an index.php file is created with some simple PHP code that defines few variables and prints their values.
- Subsequently, create an xdebug.ini file to store the xdebug configuration for your project. The xdebug.client host defines the hostname or IP address where your debugging client (VS Code) will run. The port number on which the debugging client will listen is set by the xdebug.client port. The host.docker.internal address resolves to the IP address of the Docker host from inside a container on Windows and Mac. But, for Docker on Linux, specify the IP address of the Docker host.
- Create a Dockerfile and paste this content. This Dockerfile builds a container image with the php:8.2-apache base image. It also installs/enables the xdebug PHP extension, copies all files to the container, exposes the 8090 port, and finally starts the Apache web server in foreground mode.
- Add some tasks to the Visual Studio Code. These tasks contain commands and arguments for building and running Docker containers. The tasks are defined in the tasks.json file in the .vscode directory. Two tasks are defined here: Build app image and Run app container. The first builds a container image while the second creates a container. The –volume argument is crucial as it binds the current directory on the host to the /var/www/html directory in the container.
- Create a launch configuration to define the steps that run on starting the Visual Studio Code debugger. These configurations are stored in a launch.json file in the .vscode directory. The port field defines the port number task where Visual Studio Code will listen, and it should match the port number specified in the xdebug.ini file. The pathMappings field maps the current workspace directory of Visual Studio Code with the container’s /var/www/html directory.
- You can optionally add a .dockerignore file to specify the files or directories you want to avoid copying.
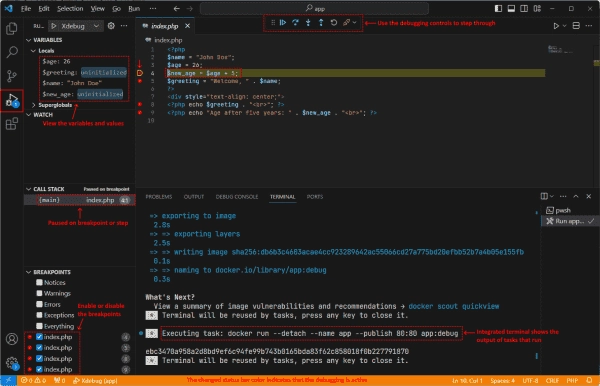
- To stop the app at the debugger, you need to set some breakpoints in your code file.
- Switch to Run and Debug view of Visual Studio Code by pressing the Ctrl+Shift+D keys. From the dropdown, select the desired configuration if multiple launch configurations exist in the launch.json file. To start debugging, click the small green play button or press the F5 key.
- Ensure the correct host and port are defined in the xdebug.ini file under the clienthost and clientport fields.
- Open a web browser and type http://localhost in the address bar. The code will pause on hitting a breakpoint, and you will be redirected to the Visual Studio Code window.
- App execution can be restarted by running the docker rm -f $(docker ps -aq -f name=app) command to remove the running app container and start over.