Graylog serves as a comprehensive open-source platform dedicated to centralized log collection, storage, visualization, filtering, searching, and analysis. In addition, it is capable of performing monitoring functions and generating alerts. Graylog is designed to gather logs and events from a vast array of network devices, which include Linux servers, Windows servers, and various network appliances or hardware. As a robust solution, Graylog has the capacity to manage terabytes of log data while enabling rapid search capabilities. This guide discusses the deployment of the Graylog stack along with its fundamental functionalities for logging tasks.
Components that constitute the Graylog stack include:
- Graylog Server – the web interface for configuration and visualization.
- MongoDB – the database responsible for storing metadata.
- ElasticSearch or its alternative OpenSearch – utilized for storing and performing full-text searches on both structured and unstructured logs.
- Java (OpenJDK) – serves as the runtime for OpenSearch (or ElasticSearch).
For log storage, we will implement OpenSearch, which is a free and open-source alternative to the ELK stack (Elasticsearch + Logstash + Kibana).
How to Install the Graylog Stack on Linux Systems
The process of installing the Graylog stack varies significantly based on the version you are using. Consequently, we highly recommend visiting the official Graylog documentation to manually select your specific Linux distribution and Graylog version. This guide is based on Debian 12 and Graylog 5.2.
The Graylog stack can be deployed using docker-compose; however, this guide will focus on a complete deployment of all components.
In this guide, we will utilize:
- OpenJDK 17
- OpenSearch 2.x (or Elasticsearch 7.10.2 – the only version compatible with Graylog 5.2)
- MongoDB 5.x or 6.x (Deployment of MongoDB 7 is currently not advised)
- For minimal installations, Graylog Server requires at least 2GB of RAM.
Begin by installing the necessary prerequisites and adding the MongoDB 6 repository:
$ sudo apt-get install gnupg curl
$ curl -fsSL https://www.mongodb.org/static/pgp/server-6.0.asc | sudo gpg -o /usr/share/keyrings/mongodb-server-6.0.gpg –dearmor
$ echo “deb [ signed-by=/usr/share/keyrings/mongodb-server-6.0.gpg] http://repo.mongodb.org/apt/debian bullseye/mongodb-org/6.0 main” | sudo tee /etc/apt/sources.list.d/mongodb-org-6.0.list
$ sudo apt-get update
Next, proceed to install the MongoDB package:
$ sudo apt-get install -y mongodb-org
In my experience, trying to install Mongodb on Debian 12 led to an issue:
The following packages have unmet dependencies:
mongodb-org-mongos: Depends: libssl1.1 (>= 1.1.1) but it is not installable
mongodb-org-server: Depends: libssl1.1 (>= 1.1.1) but it is not installable
I had to install an additional libssl package:
Resolve this by installing the libssl package.
$ sudo wget http://archive.ubuntu.com/ubuntu/pool/main/o/openssl/libssl1.1_1.1.1f-1ubuntu2_amd64.deb

$ sudo dpkg -i libssl1.1_1.1.1f-1ubuntu2_amd64.deb
To start the service:
$ sudo systemctl daemon-reload

$ sudo systemctl enable mongod.service

$ sudo systemctl restart mongod.service

$ sudo systemctl --type=service --state=active | grep mongod
Next, continue with the installation of OpenSearch.
$ sudo apt-get update && sudo apt-get -y install lsb-release ca-certificates curl gnupg2
To add the repository, execute the following commands:
$ curl -o- https://artifacts.opensearch.org/publickeys/opensearch.pgp | sudo gpg --dearmor --batch --yes -o /usr/share/keyrings/opensearch-keyring

$ echo "deb [signed-by=/usr/share/keyrings/opensearch-keyring] https://artifacts.opensearch.org/releases/bundle/opensearch/2.x/apt stable main" | sudo tee /etc/apt/sources.list.d/opensearch-2.x.list

$ sudo apt update
Beginning with OpenSearch version 2.12, it is mandatory to create an administrator password when installing:
$ sudo OPENSEARCH_INITIAL_ADMIN_PASSWORD=$(tr -dc A-Z-a-z-0-9_@#%^-_=+ < /dev/urandom | head -c${1:-32}) apt-get install opensearch
Then, proceed to adjust the OpenSearch settings:
$ sudo nano /etc/opensearch/opensearch.yml
To set up a basic single-node configuration, you only need to adjust the following parameters:
cluster.name: graylog
node.name: ${HOSTNAME}
path.data: /var/lib/opensearch
path.logs: /var/log/opensearch
discovery.type: single-node
network.host: 0.0.0.0
action.auto_create_index: false
plugins.security.disabled: true
indices.query.bool.max_clause_count: 32768
Next, you should configure the SMTP server settings to facilitate sending email notifications:
transport_email_enabled = true
transport_email_hostname = smtp.gmail.com
transport_email_port = 465
transport_email_use_auth = true
transport_email_use_tls = false
transport_email_use_ssl = true
transport_email_auth_username =
transport_email_auth_password =
transport_email_subject_prefix = [graylog]
transport_email_from_email =
transport_email_web_interface_url =
Next, you’ll want to modify the default Java configuration settings:
$ sudo nano /etc/opensearch/jvm.options
Utilize the Xms and Xmx options to define the maximum memory allocation for the Java Virtual Machine. A good rule of thumb is to allocate half of the available RAM on your server. For instance, if your system is equipped with 8GB of RAM, you should allocate 4GB as follows:
-Xms4g
-Xmx4g
To adjust the virtual memory settings, you can use the following commands:
$ sudo sysctl -w vm.max_map_count=262144

$ sudo echo 'vm.max_map_count=262144' >> /etc/sysctl.conf
Next, initiate the OpenSearch service with this command:
$ sudo systemctl enable --now opensearch
Next, you will want to install the Graylog Server. There are two available versions of Graylog: the free Graylog Open and the subscription-based enterprise version known as Graylog Operations.
To install Graylog Open, follow these commands:
$ wget https://packages.graylog2.org/repo/packages/graylog-5.2-repository_latest.deb
$ sudo dpkg -i graylog-5.2-repository_latest.deb
$ sudo apt-get update && sudo apt-get install graylog-server
Make sure to create passwords for the variables password_secret and root_password_sha2. The Graylog server will not initiate without these passwords.
The password password_secret should have a minimum length of 64 characters:
$ pwgen -N 1 -s 96
Next, retrieve the hash for the Graylog administrator password. Use the command below to create a hash of the specified password:
$ echo -n "Enter Password: " && head -1 < /dev/stdin | tr -d '' | sha256sum | cut -d" " -f1
Insert the values for password_secret and root_password_sha2 into the configuration file located at /etc/graylog/server/server.conf.
Configure the IP address and port for the Graylog web server by adjusting the http_bind_address setting.
To begin using Graylog, execute the following command:
$ sudo systemctl enable --now graylog-server
Initiating Your Graylog Configuration
Begin by accessing the Graylog web interface with the admin username and the password hash you set in the configuration file. Be aware that this password will not be recognized during your initial login attempt.
Examining the Graylog server logs will reveal a noteworthy message:
$ cat /var/log/graylog-server/server.log
It appears that you are launching Graylog for the first time. A setup interface has been initiated for a fresh installation. To perform the initial configuration and proceed, you must log in. The initial configuration can be accessed at 0.0.0.0:9000, using the username 'admin' and the password 'eDLaYAlaeX'. You can click on http://admin:[email protected]:9000
Utilize the temporary password from the log file for your first sign-in. Follow the straightforward initial configuration wizard. The Graylog data node mode is utilized to set up a multi-node OpenSearch cluster. If you’re configuring a simpler setup with a single log host, this step can be bypassed.
Next, access the Graylog web interface with the admin user and the provided password:
After logging in, create your Graylog user by navigating to System -> Users and Teams. Certain settings of the built-in Admin account are not customizable; therefore, it is advisable to establish a separate user account. Assign this user the Admin role and provide an email address.
It’s time to set up the Inputs (data collectors). Ideally, each input should be dedicated to a specific device category, such as Linux servers, networking devices, Windows hosts, and so forth.
We will establish a Syslog UDP input specifically for Linux hosts. You’ll need to provide a name along with the port number that the Graylog server will use to receive data. You can keep the remaining settings at their default values.
Next, navigate to System -> Indices and set up a distinct index for the Linux device category.
You’ll need to indicate a name, a description, and a prefix (for example, linux_indx). Additionally, configure how many days you want to retain older logs, the timeline for deleting obsolete indexes, and the maximum size for each index.
Establish a distinct Stream for each input. This method helps in categorizing logs from various device classes into separate indexes. Navigate to Stream -> Create Stream -> designate a name for the stream and choose the index you prefer to utilize.
Within the Stream settings, introduce a new rule that defines the type of logs allocated to this stream. For instance, opt for Match Input -> select your Linux Input.
Subsequently, activate the stream.
How to Transfer Logs from Linux to Graylog
Next, set up your client devices to forward events and logs to Graylog. Graylog is capable of receiving data from multiple sources including Filebeat, Winlogbeat, Nxlog, Syslog, and Rsyslog.
For collecting logs and transmitting them to Graylog, you can utilize rsyslog on Linux servers.
To install rsyslog, run the following command:
$ sudo apt install rsyslog
To check the status of rsyslog, use this command:
$ sudo systemctl status rsyslog
When the rsyslog service is operational, it’s time to set up the logs that will be directed to Graylog.
$ sudo nano /etc/rsyslog.d/60-graylog.conf
Insert the subsequent line into the file:
*.*@192.168.14.146:20514;RSYSLOG_SyslogProtocol23Format
In this scenario, we will forward all logs in syslog format to the Graylog server located at 192.168.14.146, using the designated input port of 20514.
To apply the changes, restart the rsyslog service:
$ sudo systemctl restart rsyslog
Searching and Analyzing Logs in Graylog
Next, navigate to the Search Graylog section, and choose the ‘Linux’ stream. This will display all events that have been collected from your hosts over the last 5 minutes (you can adjust the time frame as needed).
You can apply straightforward filters to pinpoint specific events. The Graylog search bar is designed to be user-friendly. In it, you can select various event properties and pick from the provided options.
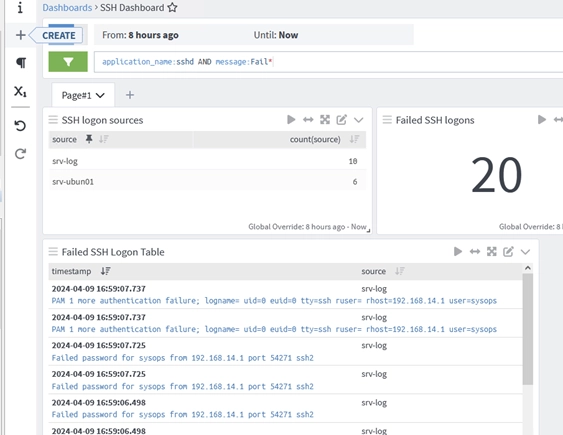
For instance, to locate all events pertaining to unsuccessful SSH connection attempts to a host, you can use the following search filter:
source:srv-ubun01 AND application_name:sshd AND message:Fail*
This query retrieves all logs that fulfill all three criteria (using the AND parameter). In the absence of the AND specification, Graylog defaults to searching for events in OR mode.
The resulting table will display events that align with your search parameters. You can expand and delve into the specifics of each log detail. The search filters in Graylog are straightforward and user-friendly, allowing for easy exploration. You can always expand any event to view its available fields (event attributes) and use those values to refine your search for particular events.
Graylog offers the capability to create and tailor various dashboards that showcase information about events of interest (which may include counts of events, hosts, grouped items, visual graphs, or maps). Dashboards can be customized using widgets.
Setting Up Graylog Alerts for Event Occurrences
In certain situations, Graylog has the capability to send automatic notifications, commonly referred to as alerts. For instance, I would like to set up Graylog to notify me via email whenever someone accesses one of my servers through SSH.
To begin, navigate to Alerts -> Alerts and Events. Within the Notification tab, you can enter the email addresses that will receive these alerts.
Next, you will want to create a query to identify the specific events that you wish to be alerted about in the Event Definition. If you are interested in monitoring SSH logins to Linux systems, select the relevant stream and provide a suitable search query:
application_name:sshd AND message:Accepted password*
A list of events that match your search criteria will show up in the right preview pane. Make sure that all the events you intended to find are present. If any are missing, feel free to modify your search query.
Next, you need to choose your notification type -> email. When a specific event occurs in the logs, Graylog will automatically send out an email notification.
This article has provided an overview of deploying and using Graylog for the purposes of centralized log collection and analysis. In the upcoming article, we will explore how to use Graylog for the centralized collection and search of logs from Windows servers.