In Windows, certain processes can significantly increase disk I/O, adversely affecting overall system performance. This guide outlines essential Windows tools for identifying these high-disk-load processes.
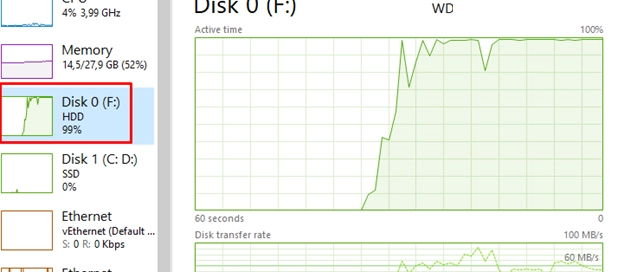
To start, the Task Manager is the most straightforward tool to monitor disk usage. You can access it by pressing Ctrl + Shift + Esc. Navigate to the Performance tab and select a physical disk to view its load, as shown when a disk is at 100% usage.
Under the Processes tab, you can find detailed information on which processes are consuming excessive disk resources. In Windows 10 and 11, there’s a specific column for disk load that can be added for sorting purposes. By sorting the processes by the Disk column, you can easily see which applications are utilizing the most disk resources.
For a deeper analysis, you can right-click on a process and select Go to Details. Additionally, it’s useful to add more columns such as I/O read bytes, I/O write bytes, and Command line to better understand the disk usage patterns and the commands used to launch the processes.
Identifying the specific files that are being accessed can be done using the Resource Monitor, which can be launched from the Performance tab or via the resmon.exe command. By navigating to the Disk tab and filtering the list by I/O activity, you can isolate the file generating high disk activity.
Moreover, Microsoft’s Process Explorer can offer more granular insight into disk loads. By default, it does not show read or write operations. To view this, you’ll need to add the I/O Read Bytes and I/O Write Bytes columns through the Process I/O tab. In the Threads tab, you can investigate specific threads of processes that contribute to high disk I/O.
If you’re troubleshooting complex scenarios, especially those with processes running under SYSTEM privileges—which may not be visible in Task Manager—using Process Monitor provides comprehensive visibility into disk I/O activities across all processes, including kernel-level activity.
The following PowerShell command can also assist in real-time monitoring of disk activity across running processes:
Get-Counter 'Process(*)IO Data Bytes/sec' | Select-Object -ExpandProperty CounterSamples | Sort-Object -Property CookedValue -Descending | Select-Object InstanceName, CookedValue -First 10Additionally, Sysinternals’ Handle command can reveal which files a specific process is using. You would run it as follows:
handle.exe -p <ProcessNameOrPID>Through these tools and commands, you can efficiently identify and manage processes that lead to high disk usage, helping to maintain optimal system performance.